I tracked all of my alcohol drinks for an entire year. All 744 of them. That's right, I drank a grand total of 744 alcoholic beverages in 2023. That's more than 2 drinks a day! Sounds like it lot, doesn't it? But is it really a lot? Let's have a look.
Proost
How and why?
The how-question is answered very easily. I simply kept a tally of every drink I had for 365 days. It's not rocket science. I'll go a bit more in depth in the chapter 'How I tracked my data', but it's very straightforward. The only important thing to note is that I converted each drink to a standard unit drink of 10 grams of alcohol. This will make it easy to compare various numbers later on.
The why behind this challenge is also easy to pinpoint (see the trend? I'm a simple man). I started tracking my alcohol consumption in 2023 in order to fill in the blanks in my annual-data-based reflection. You see: in 2022 I used my sport data (Strava) and reading data (Goodreads) to find interesting trends in my life. I found out that I become concerningly inactive during the summer months. For some reason I hardly do any reading or sporting during that time.
I assumed that my summer lethargy was due to the many holidays & social events, and therefore also an increase in alcohol consumption.
But is that really true? There is only one way to find out. By tracking all of my alcohol consumption.
Trend analysis
Alright, lets immediately fall with the door into the house (sorry, couldn't help to sprinkle a bit of Dunglish in here). The summer seems to have started in week 21 for me (May 22nd-28th). From that moment until week 28 I consumed above average (for me) amounts of alcohol.
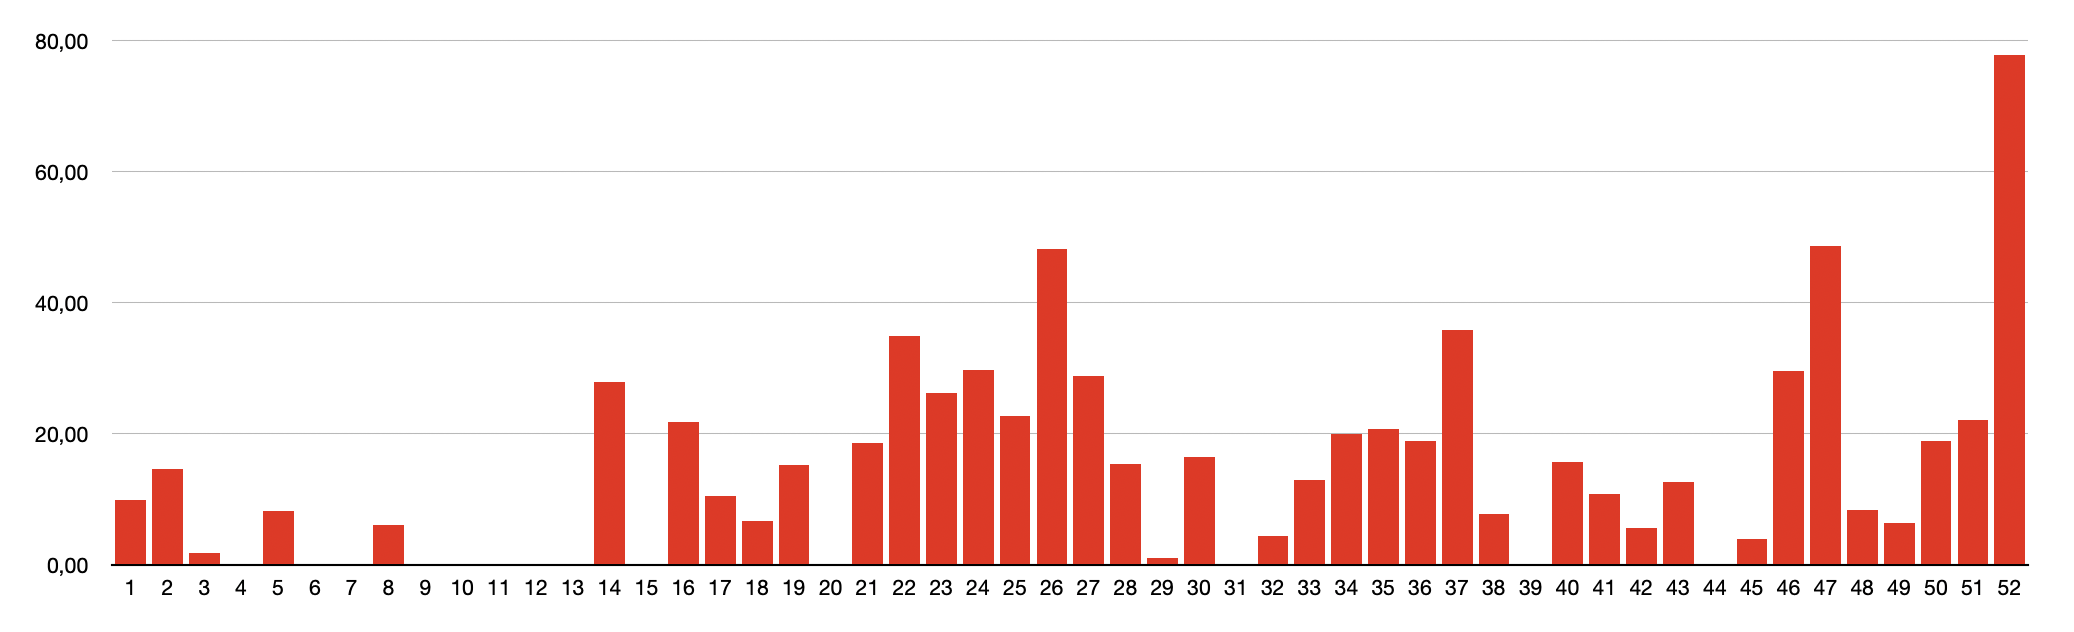
Standard drinks per week
Looking back in my agenda I can deduce that all the drinking was indeed linked to various social events. These weeks were a continuous chain of; festivals, friends visiting us in Malta, 'friends weekend' in the Netherlands, 'family weekend' in the UK, and a two week long 'business trip' to Marbella.
The same goes up for the little bump at the end of August / start of September [week 33-37]. Many social events and traveling in that period. Idem dito for week 46 & 47.
I'm sorry that I don't have a nice way to visualise or quantify these 'social events' I hadn't really thought of that before, but it would've looked great in the graph above. Anyway, looking back in my agenda suffices to see the correlation between social events and the increase in alcohol.
Fortunately there is another metric that I can visualise and that is my physical activity. I've exported my Strava data and plotted it against my alcohol consumption. It shows quite clearly that the start of the year comes with lots of sporting and little alcohol (all the good intentions...), whilst the rest of the year seems to be a bit more chaotic.
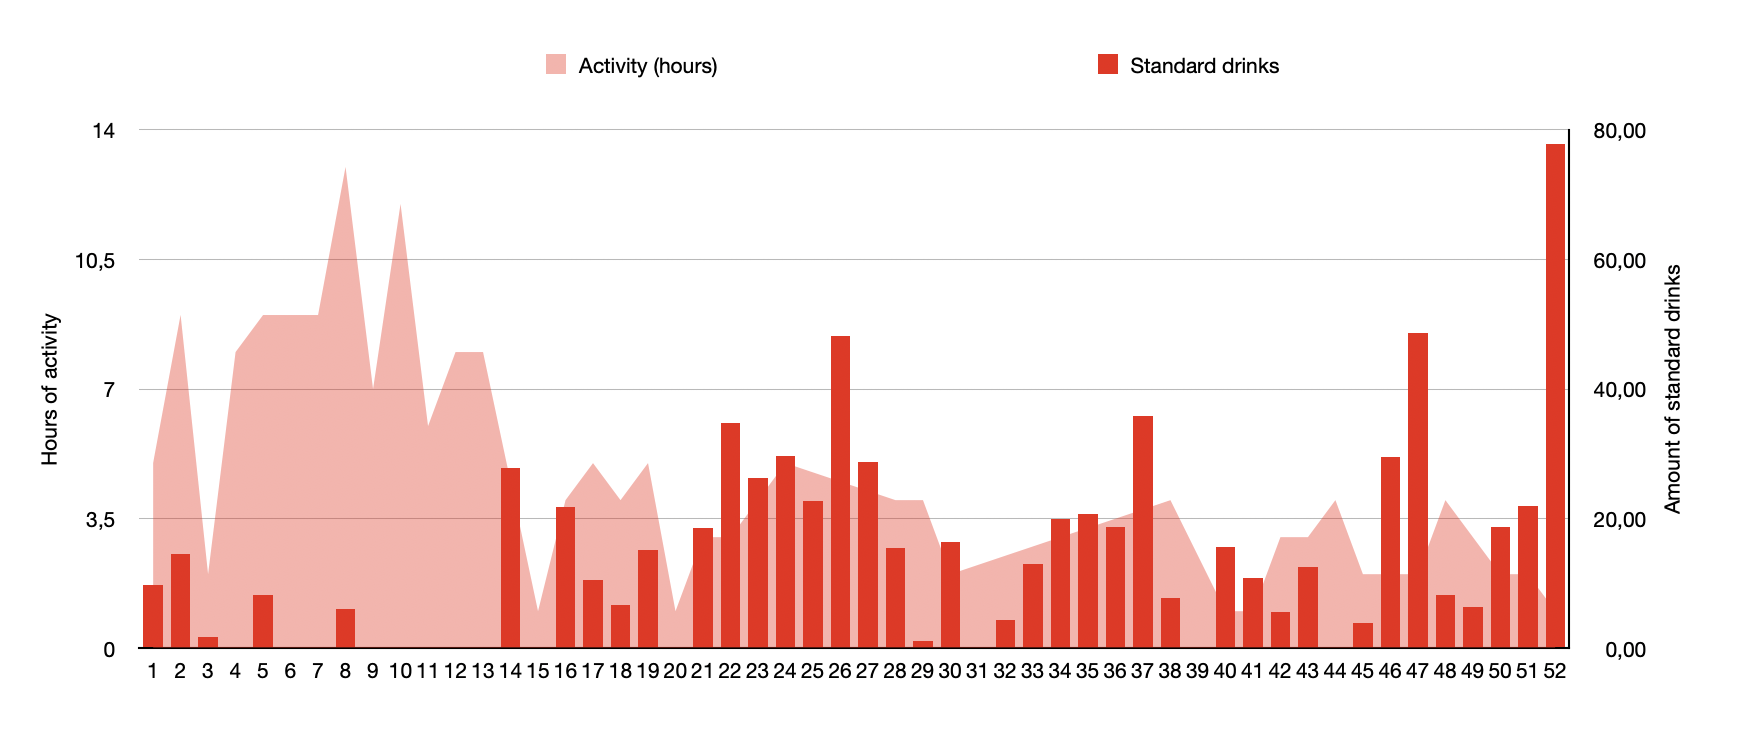
Hours of (sport) activity per week vs amount of standard drinks per week
Now I cannot leave the elephant in the room unaddressed. You must all be wondering what the heck happened in week 52?! Well... let's just say I celebrated Christmas in England :)
Talking about the impact of British Christmas traditions on my alcohol consumption chart piqued my interested in the impact of various geographical locations on my drinking habits. So let's go have a look at that now!
Location analysis
To enable this analysis, I had to log the location for each alcoholic beverage that I consumed. And that's exactly what I did. With this data we can now determine various interesting insights such as: what country served me the weakest drinks? And where do I drink the most?
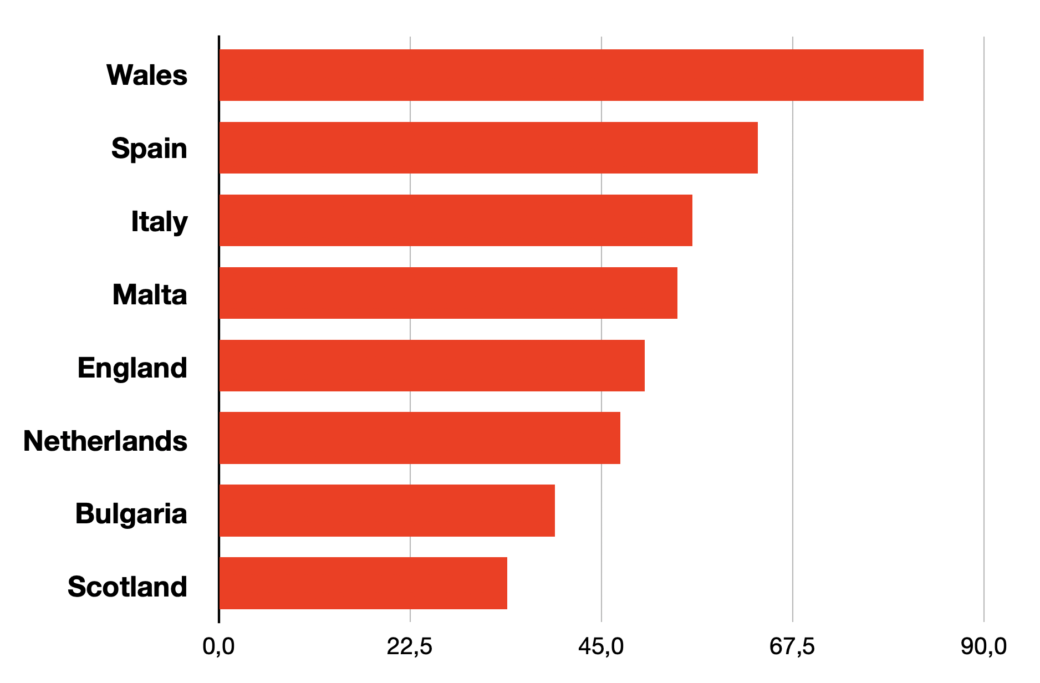
Drink strength per location (alcohol per volume (g/L))
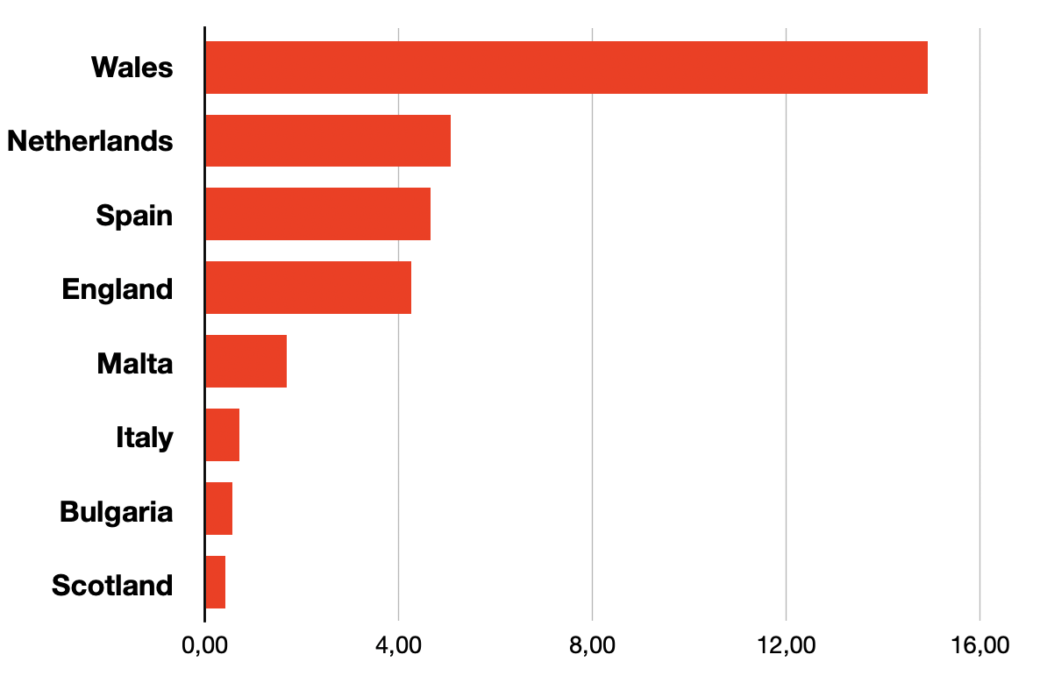
Drinks per day per location
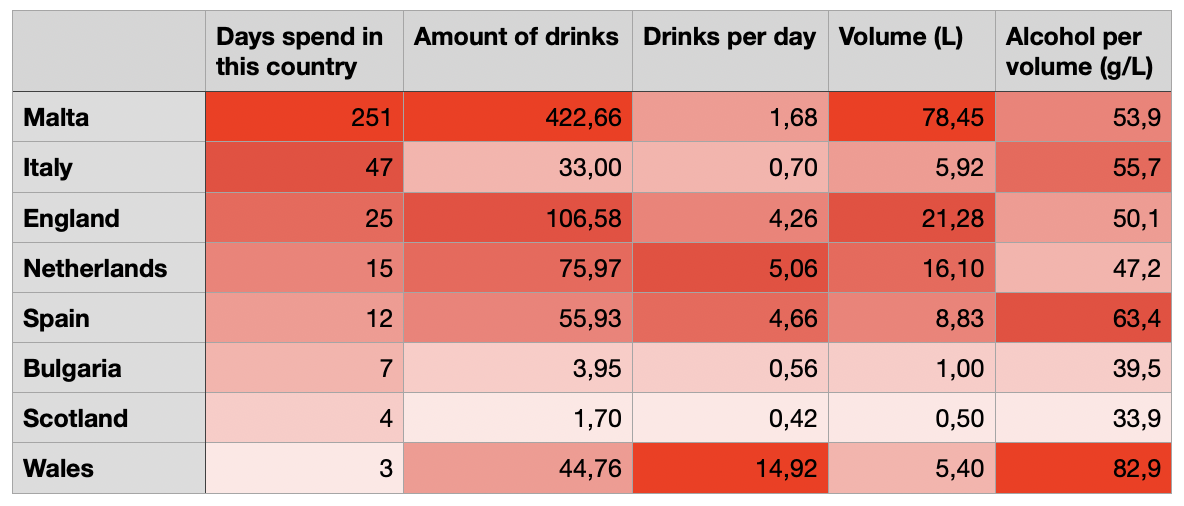
Looking at the data the first thing you'll notice is that Wales is really pulling its weight here. I only spend three days there, but it managed to make its way to the top of almost every list. It's the place where I drank the most drinks per day (14,92 standard units per day on average) And not just that, the drinks I drank there were also the strongest on average! I recall drinking a lot of sloe-gin and red wine!
Furthermore it's interesting to mention the Netherlands; it has the second highest drinks per day score, but it scores poorly on the alcohol per volume scale. I assume this is because I mostly drink beers when I'm in the Netherlands and nothing stronger than that.
The last interesting point I wanted to mention here is my low alcohol consumption in Italy. I spent quite a lot of time in Italy this year (47 days), but didn't really drink all that much there. This is because the 1.5 months I spent in solitude in the Italian Alps coincided with Lent, which meant I was living very modestly.
I'll go a bit deeper into the topic of sobriety later, but first I think it'll be interesting to put my drinking habits in a wider context and compare it to some international standards. Just to see if my behaviour is in any way proportional, or if I'm a bit of a problematic drinker.
Comparing against averages & standards
In the table below you can see exactly how many drinks I've had in each category. By far the largest group is beer. I'm not surprised by that. Beers are easy, nice, refreshing drinks. I like them. But 109 liters of beer in a year does sound like quite a lot, doesn't it?
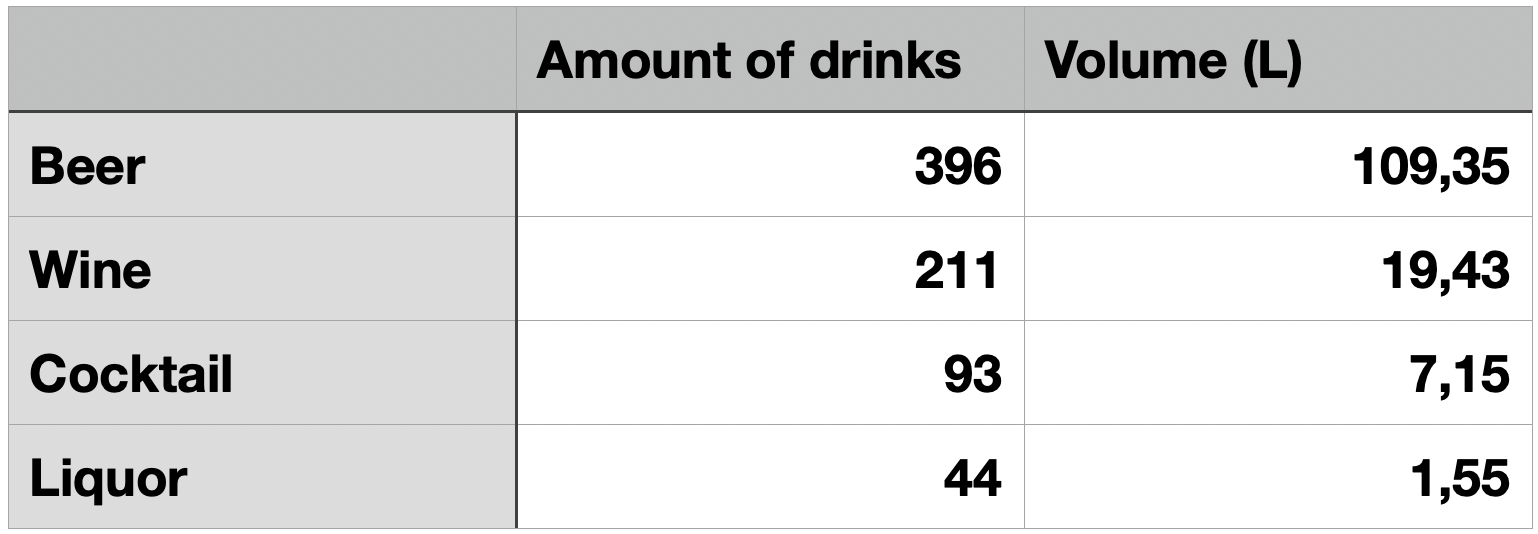
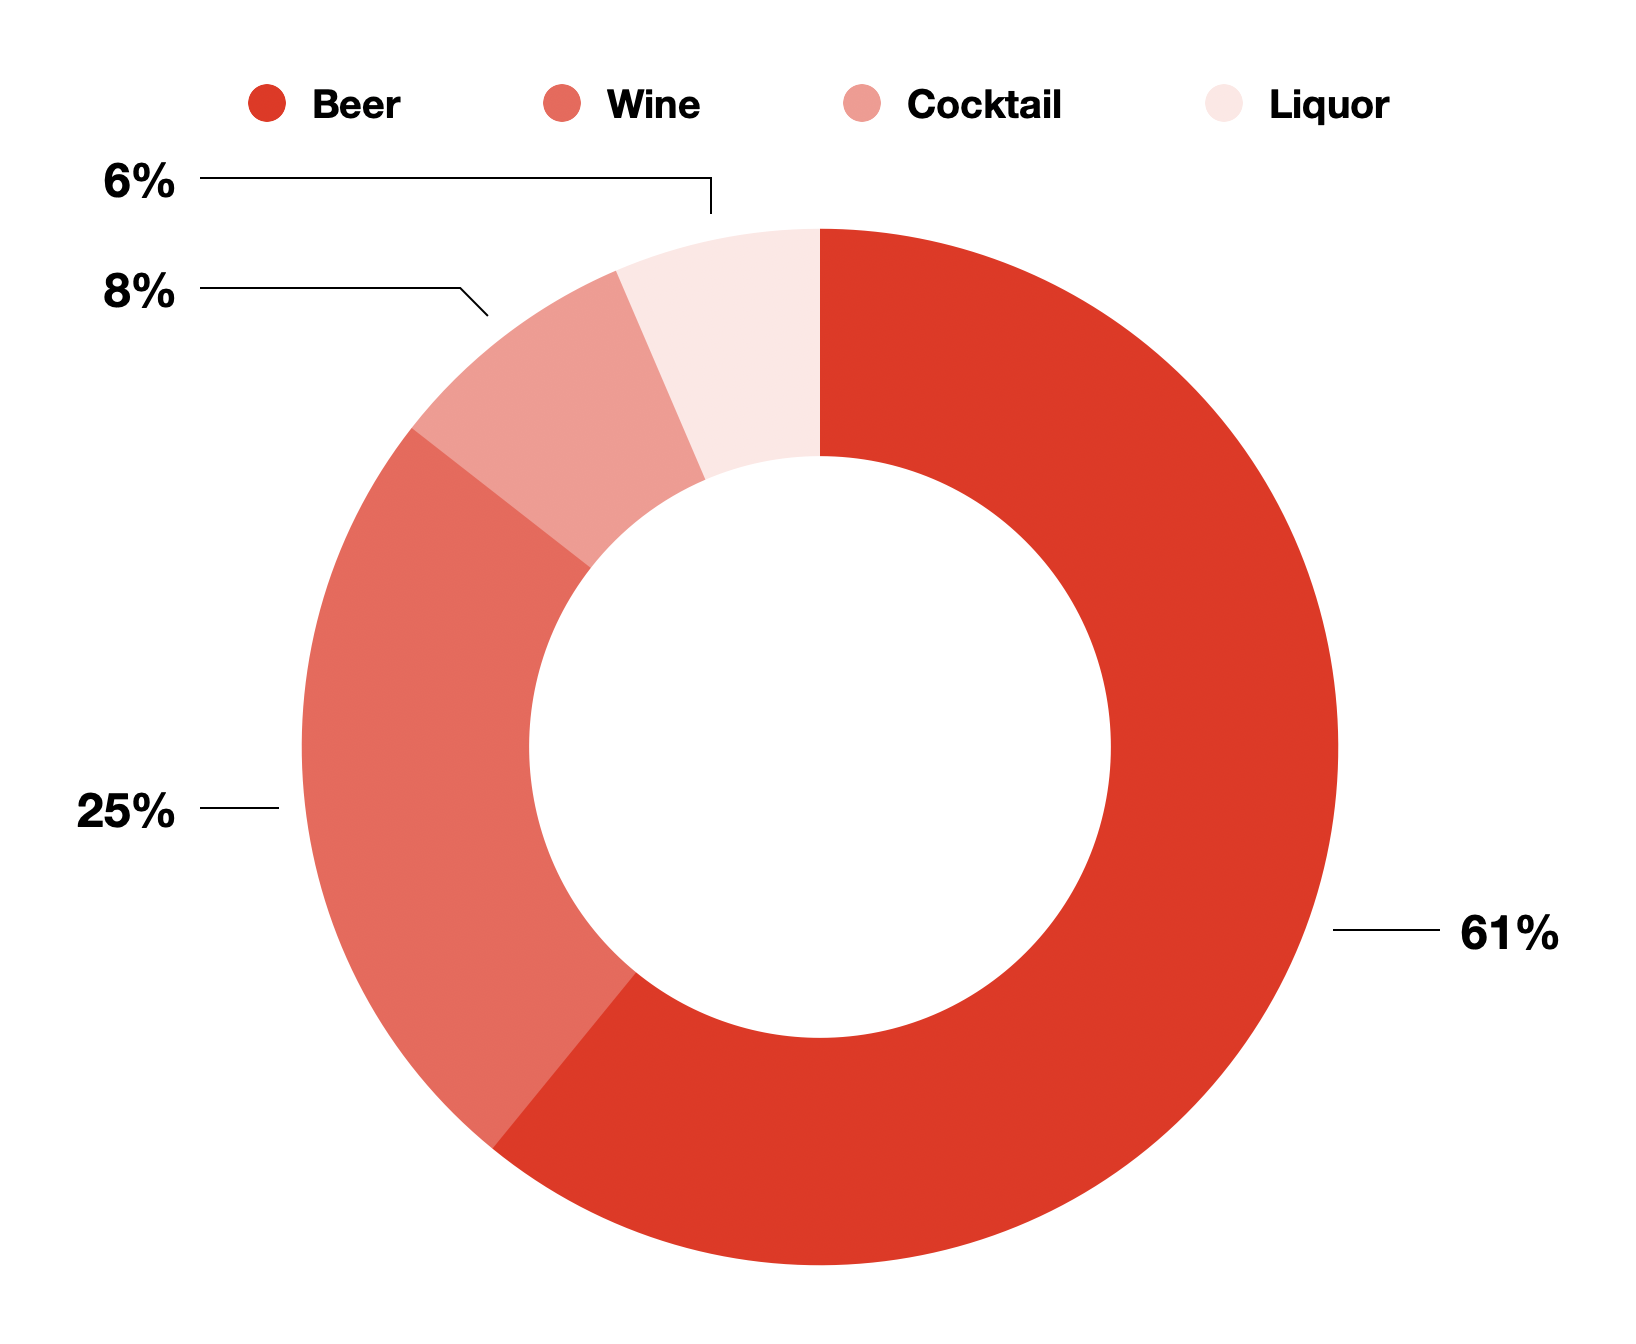
So 109 liters of beer... Is that a lot? I have no idea. To understand this data, we have to take a look at the average beer consumption of an adult. I've collected a couple of them in the table below.
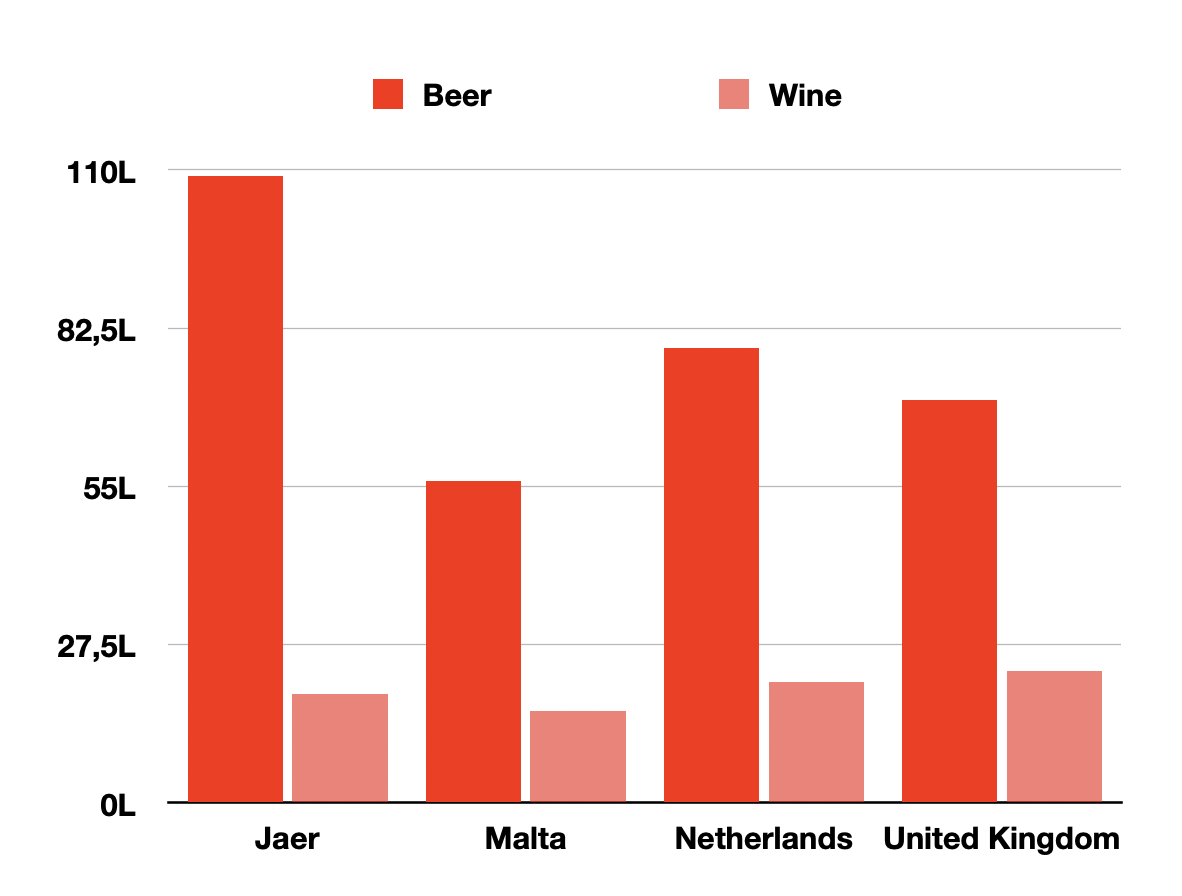

Average consumption of alcohol per country per capita (data via WHO Health Data)
Gulp... I have drank almost double the amount of beer as an average Maltese person... and about 1.5x as much as an average Dutch/UK person. That really surprises me to be honest. I've always seen myself as a fairly moderate drinker. Okay, maybe once or twice a month I will go all out at a party, but apart from that I rarely drink, right? Well... apparently not.
The caveat here is that the WHO data takes the average consumption of all adults (above the age of 15), which might be a bit too broad of a group to compare myself with. Maybe comparing myself to only the 20-30 year olds from each country would be more fair, but it still stings a bit to be honest.
It raises the question... am I a problematic drinker?
To answer that question we have to look deeper into my drinking habits.
Excessive drinking
According to the Dutch Trimbos institute for addictions, you are classified as an excessive drinker at > 21 drinks a week and you're a heavy drinker at minimally one day of > 6 drinks per week. So lets use the data to check if I'm either of those.
Excessive drinker
To be an excessive drinker you need to drink more than 21 drinks in a single week. In 2023 this has occurred to me 13 times (25% of the year). So I guess that means I'm an excessive drinker for 25% of the time. Or if we re-frame it and use some boy-math, we can say that I've had 744 standard drinks in 2023, which is an average of 744 / 52 = 14 drinks per week and all of a sudden I'm not an excessive drinker anymore! Jippie!
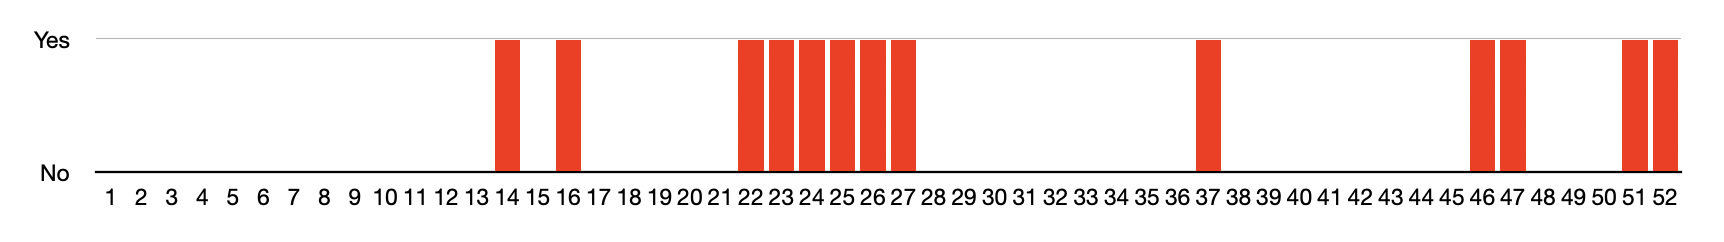
Did I drink >21 drinks this week?
Heavy drinker
A heavy drinker is defined as someone that drinks minimally once a week more than six drinks. For me this happened 51 days, spread over 26 weeks. Exactly half of the year. I'm having a bit of trouble interpreting this data. 26/52 weeks doesn't sound too bad to me. But 51 days sounds like quite a lot. Well, in any case I think it would be good to decrease my alcohol consumption.
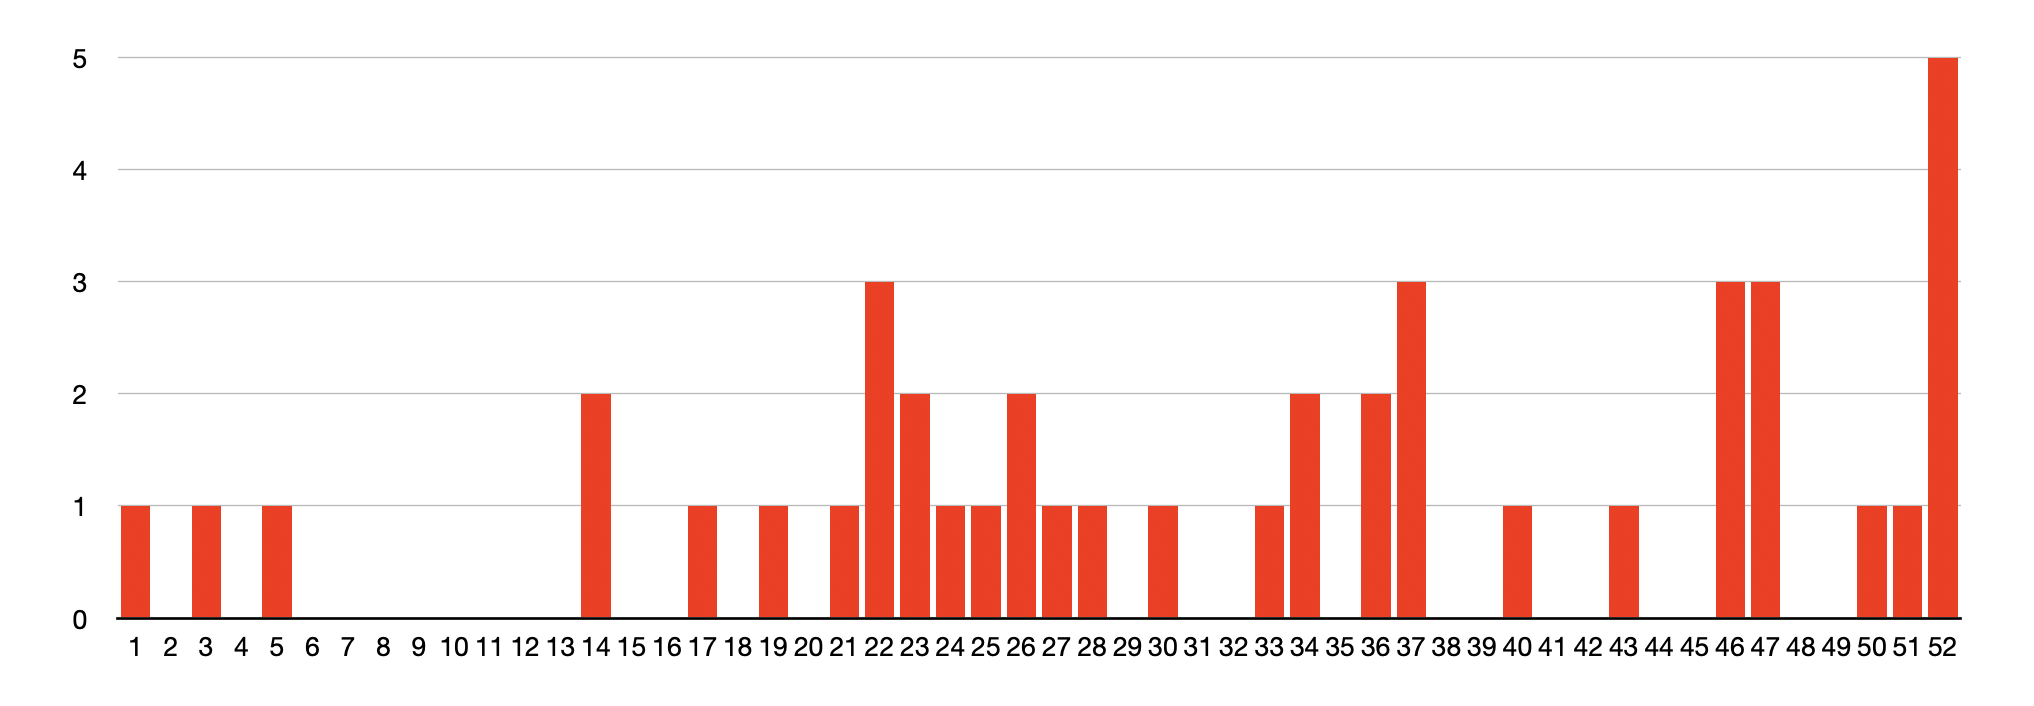
How many times per week I drank more than 6 drinks
I also would like to make the disclaimer here that 6 drinks means 6 standard drinks. One pint of regular 4.5% beer would already get you to 1.78 standard drinks, and one glass of wine equals 1,93 standard drinks. That means that if you go to the pub once a week and drink 4 pints (=7,12 standard drinks) you'll be classed as a heavy drinker.
Having said that, I also don't think it's super necessary to drink > 6 on most of the days. Of course, every now and then it's nice to blow off some steam and go a bit crazy, but I personally only really need to blow of steam once every 2/3 weeks. For all the other occasions I would say that limiting myself to < 5 drinks would be a good objective.
Sobriety
Even though some of you now might have gotten the impression that I'm a bit of an alcoholic, I don't really think that's the case. Am I being delusional? Perhaps. The data suggests that I have at least some alcoholic tendencies, even though I don't feel like I drink that much.
That's why I briefly wanted to highlight my periods of sobriety.
Standard drinks per week
In this graph you can see my consumption per week. In total there were 13 weeks in which I didn't drink a single drop of alcohol. That's about 25% of the year. Not bad I'd say.
The most significant drought took place in March. This coincides with Lent, the Catholic fasting period in which I participate. Seeing the impact of Lent being visualised pleases me very much. And realising that I've been sober for 13 out of the 52 weeks in the year also inspires me to expand on that in 2024. To me it shows that if I have a set of rules to follow (Lent) than it's no problem to limit my drinking. On the other hand it also shows that if I don't impose any limits on my drinking than I'll just sort of go with the flow and than the drinks slowly but surely add up.
I think that's an important reflection. It shows the impact of self-imposed rules and limitations.
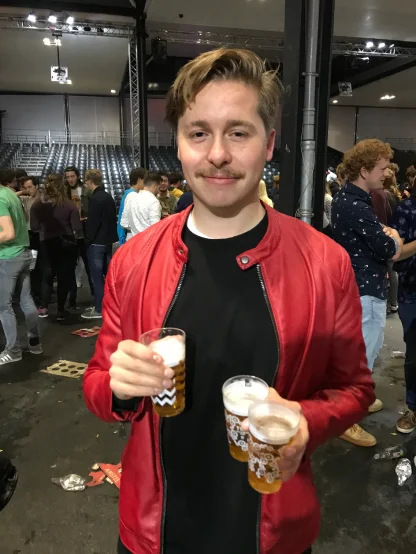
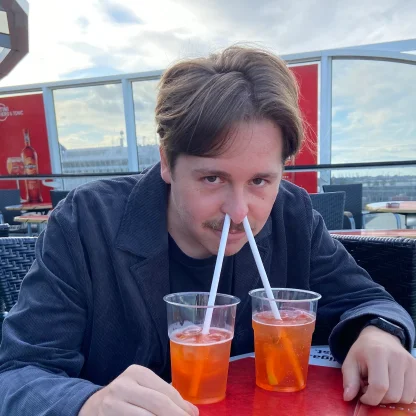
As my eyes (and hands) tell you: there were no s_elf-imposed rules and limitations_ this night
Reflection and takeaways
I started tracking my drinks in 2023 merely as a fun challenge, and to get a bit more insight into my personal behaviour. Tracking personal data can be super insightful, because a lot of times you think you know yourself, but it's actually your mind playing tricks on you.
Just like me: I wouldn't say I'm a problematic drinker. I just go about my day, do a bit of work, read a book, go for a run, and on the weekends I enjoy having a drink or two with friends. And than, ????patsboem???? the data tells me I'm an excessive drinker. Very confronting.
But of course, that's sort of the point of putting your life under the microscope. The aim is to gain new insights. So here we are, this is what I've learned about myself through this challenge:
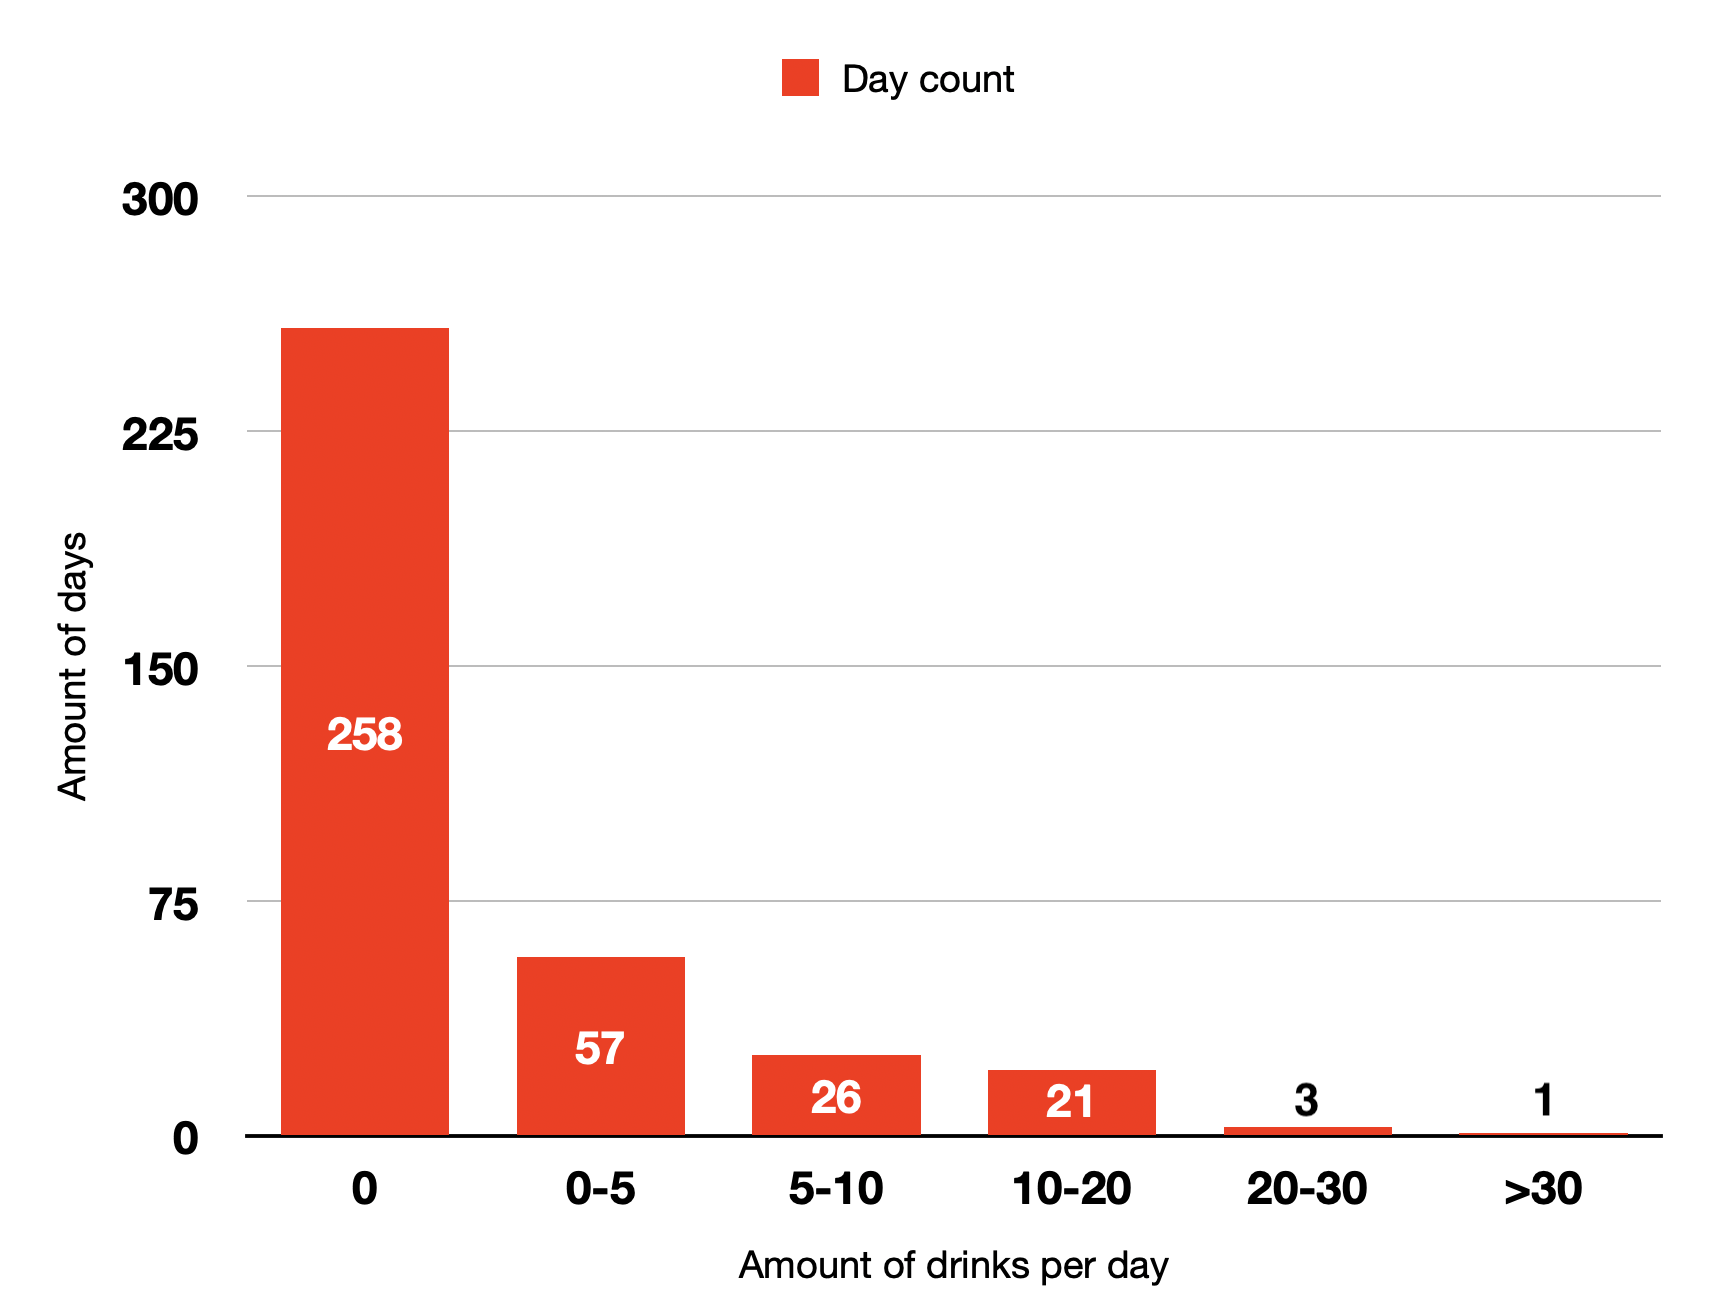
-
I stayed sober for 258 days (70% of the year)
-
25% of the weeks I drink more than 21 standard drinks (heavy drinker)
-
50% of my weeks contain at least one day in which I drink more than 6 standard drinks (excessive drinker)
-
Celebrating Christmas with my family-in-law is very unhealthy :)
-
Sporting and alcohol consumption seem to be negatively correlated: the more serious I am about sporting, the lesser I drink.
-
Setting rules (like Lent) is very effective in limiting consumption
That last point is the most important one I think and I'd like to immediately act upon it and set some ground rules for 2024.
Goals for 2024
In order to bring my excessive drinking habits down, I'll aim to:
-
Increase the amount of 0% alcohol weeks in 2024 from 13 to 26 weeks.
-
Decrease the amount of excessive drinking days (>6 drinks) from 51 to 26.
So yes, that means I will also continue to keep track of my alcohol consumption in 2024. In fact, doing this challenge has inspired me to start tracking many more aspects of my life! I'll publish more about that soon!
And with that I'd like to conclude this article. Except for the data freaks among you who are interested in 1) how exactly I tracked my data, or 2) the exact data on my favourite drinks. For you I have included a few extras in the appendix :)

I've not tracked how many drinks I've consumed via my nostrils. Maybe that would be interesting for 2024.
Favourite drinks
As you have read earlier in this article, my most consumed alcoholic beverage is beer. There have been many different types of beer in 2023 (44 identified ones), but the top three consist out of:
-
Cisk
-
Skoll
-
Hertog Jan
Now on to the more interesting drinks: cocktails!
If someone on the street would stop me and ask me 'Jaer, think quick, what is your favourite cocktail?' I would probably answer saying 'Ehm, a White Russian, or maybe a Espresso Martini?' But the data clearly shows that my most popular choice is a gin & tonic. Strange, right? Well, yes. But also: no. I think the popularity of the gin & tonic can be largely contributed the ease of preparation. It's easy to make at home and virtually every bar will be able to serve it to you.

Then we have the topic of wine, although there is not many interesting things to say about it. For the longest time white wine was my #1 most drank grape drink, but then winter came around and red wine stole the first spot. All very predictable behaviour.

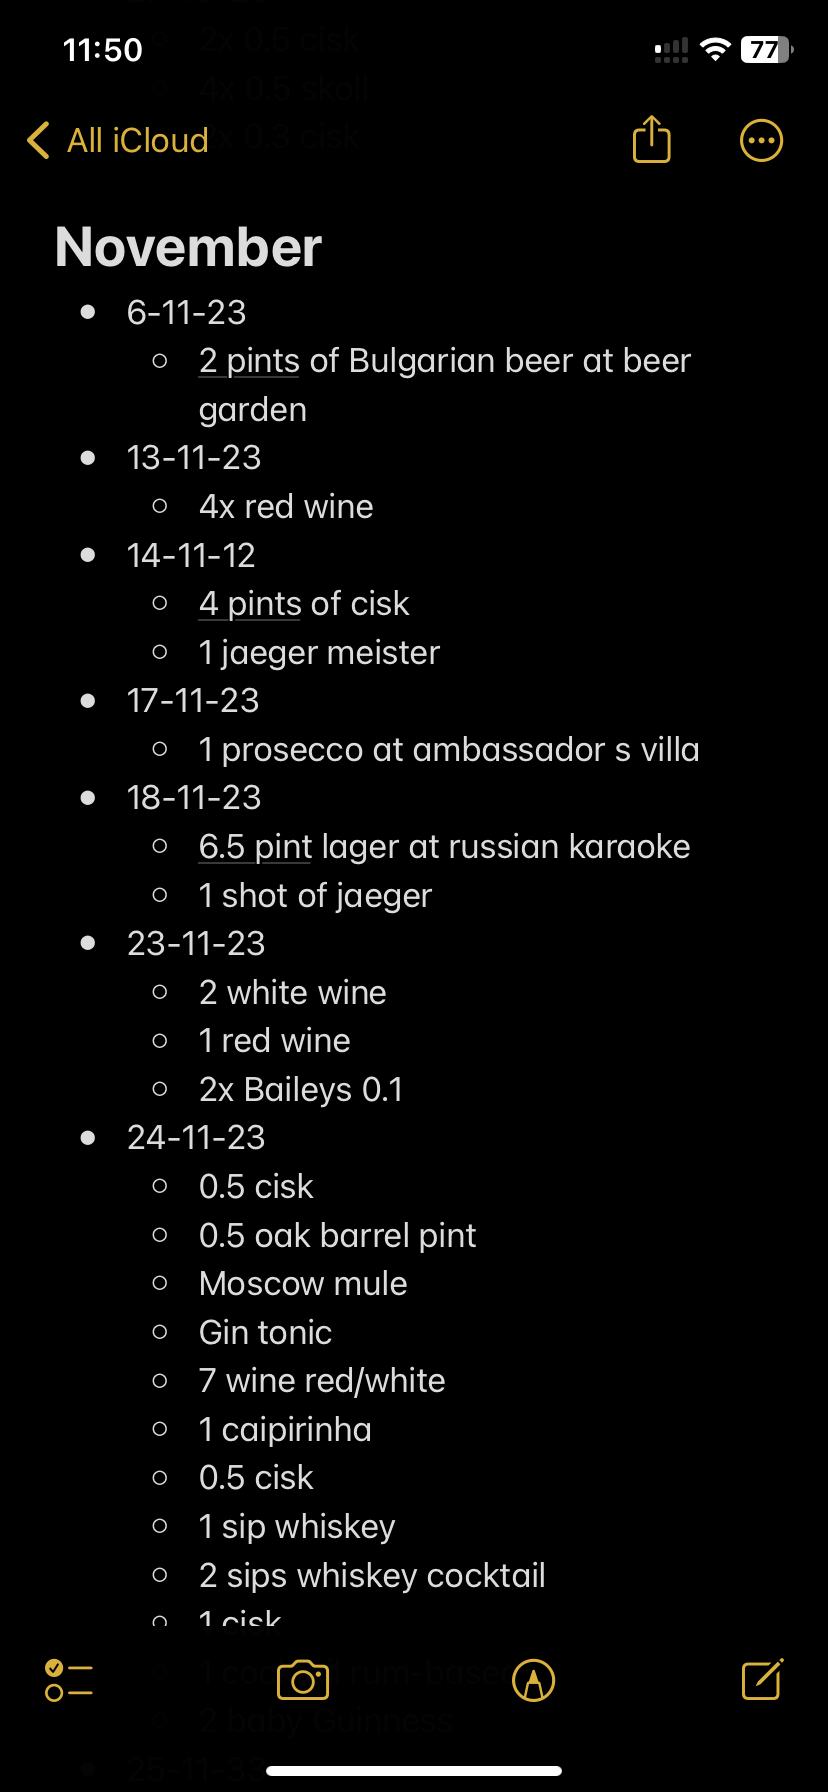
How I tracked my data
Nothing fancy, just a simple list in my Apple notes app. I honestly think people underestimate the power of Apple Notes. It's extremely quick, light-weight, and reliable. This means that almost I can instantly whip out any of my Apple devices and jot done my alcohol consumption. Very handy.
Database structure
After a couple of months of data gathering, I manually added the data points to a spreadsheet. This might sound a bit cumbersome, but it never took really long: less than ten minutes I'd say.
In my notes I recorded: type of drink + volume, but in the spreadsheet I would add additional data such as: location, alcohol percentage, drink subtype.
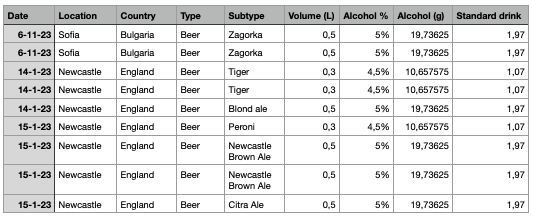
The last two columns in the table above are grams of alcohol and standard drink. I needed these two metrics to be able to compare the impact of each drink. We all have a natural understanding that one glass of wine is stronger than one glass of beer. But by how much exactly? This where the concept of the standard drink or standard unit comes in.
A standard drink represents a fixed amount of pure alcohol (measured in grams). Each country has their own ideas of what a standard drink is. E.g. Austria says that a drink containing 20 grams of alcohol is standard, whilst the UK uses the standard unit of 8 grams. The World Health Organisation uses 10 grams as a measure for a standard drink, and so do most other European countries, so I felt confident using this measure in my analysis as well.
Tracking limitations
In reality I logged most drinks the day after a night of drinking. Some people are skeptical about my capability to remember all of my drinks the morning after, but you'd be surprised how easy it is to remember. It only gets difficult after a night of ~20 drinks, or when you only drank one type of drink at one location for the entire evening. But usually there are a lot of visual markers in my memory. 'Oh the first round of drinks were beers at the bar, then we did some dancing and then we went outside for a cigarette, then we had another round of beers at the other bar, then we moved to this cocktail place and I had a gin & tonic.'
Remembering was not so much an issue most of the time. Of course, there might have been a few drinks here and there that I've forgotten to note down. And sometimes I simply made an estimate of how many beers I had at the bar. But the variance would be at most 1-2 drinks per day I'd say. Nothing too crazy.